iCetana AI
Senior Design Engineer
2023
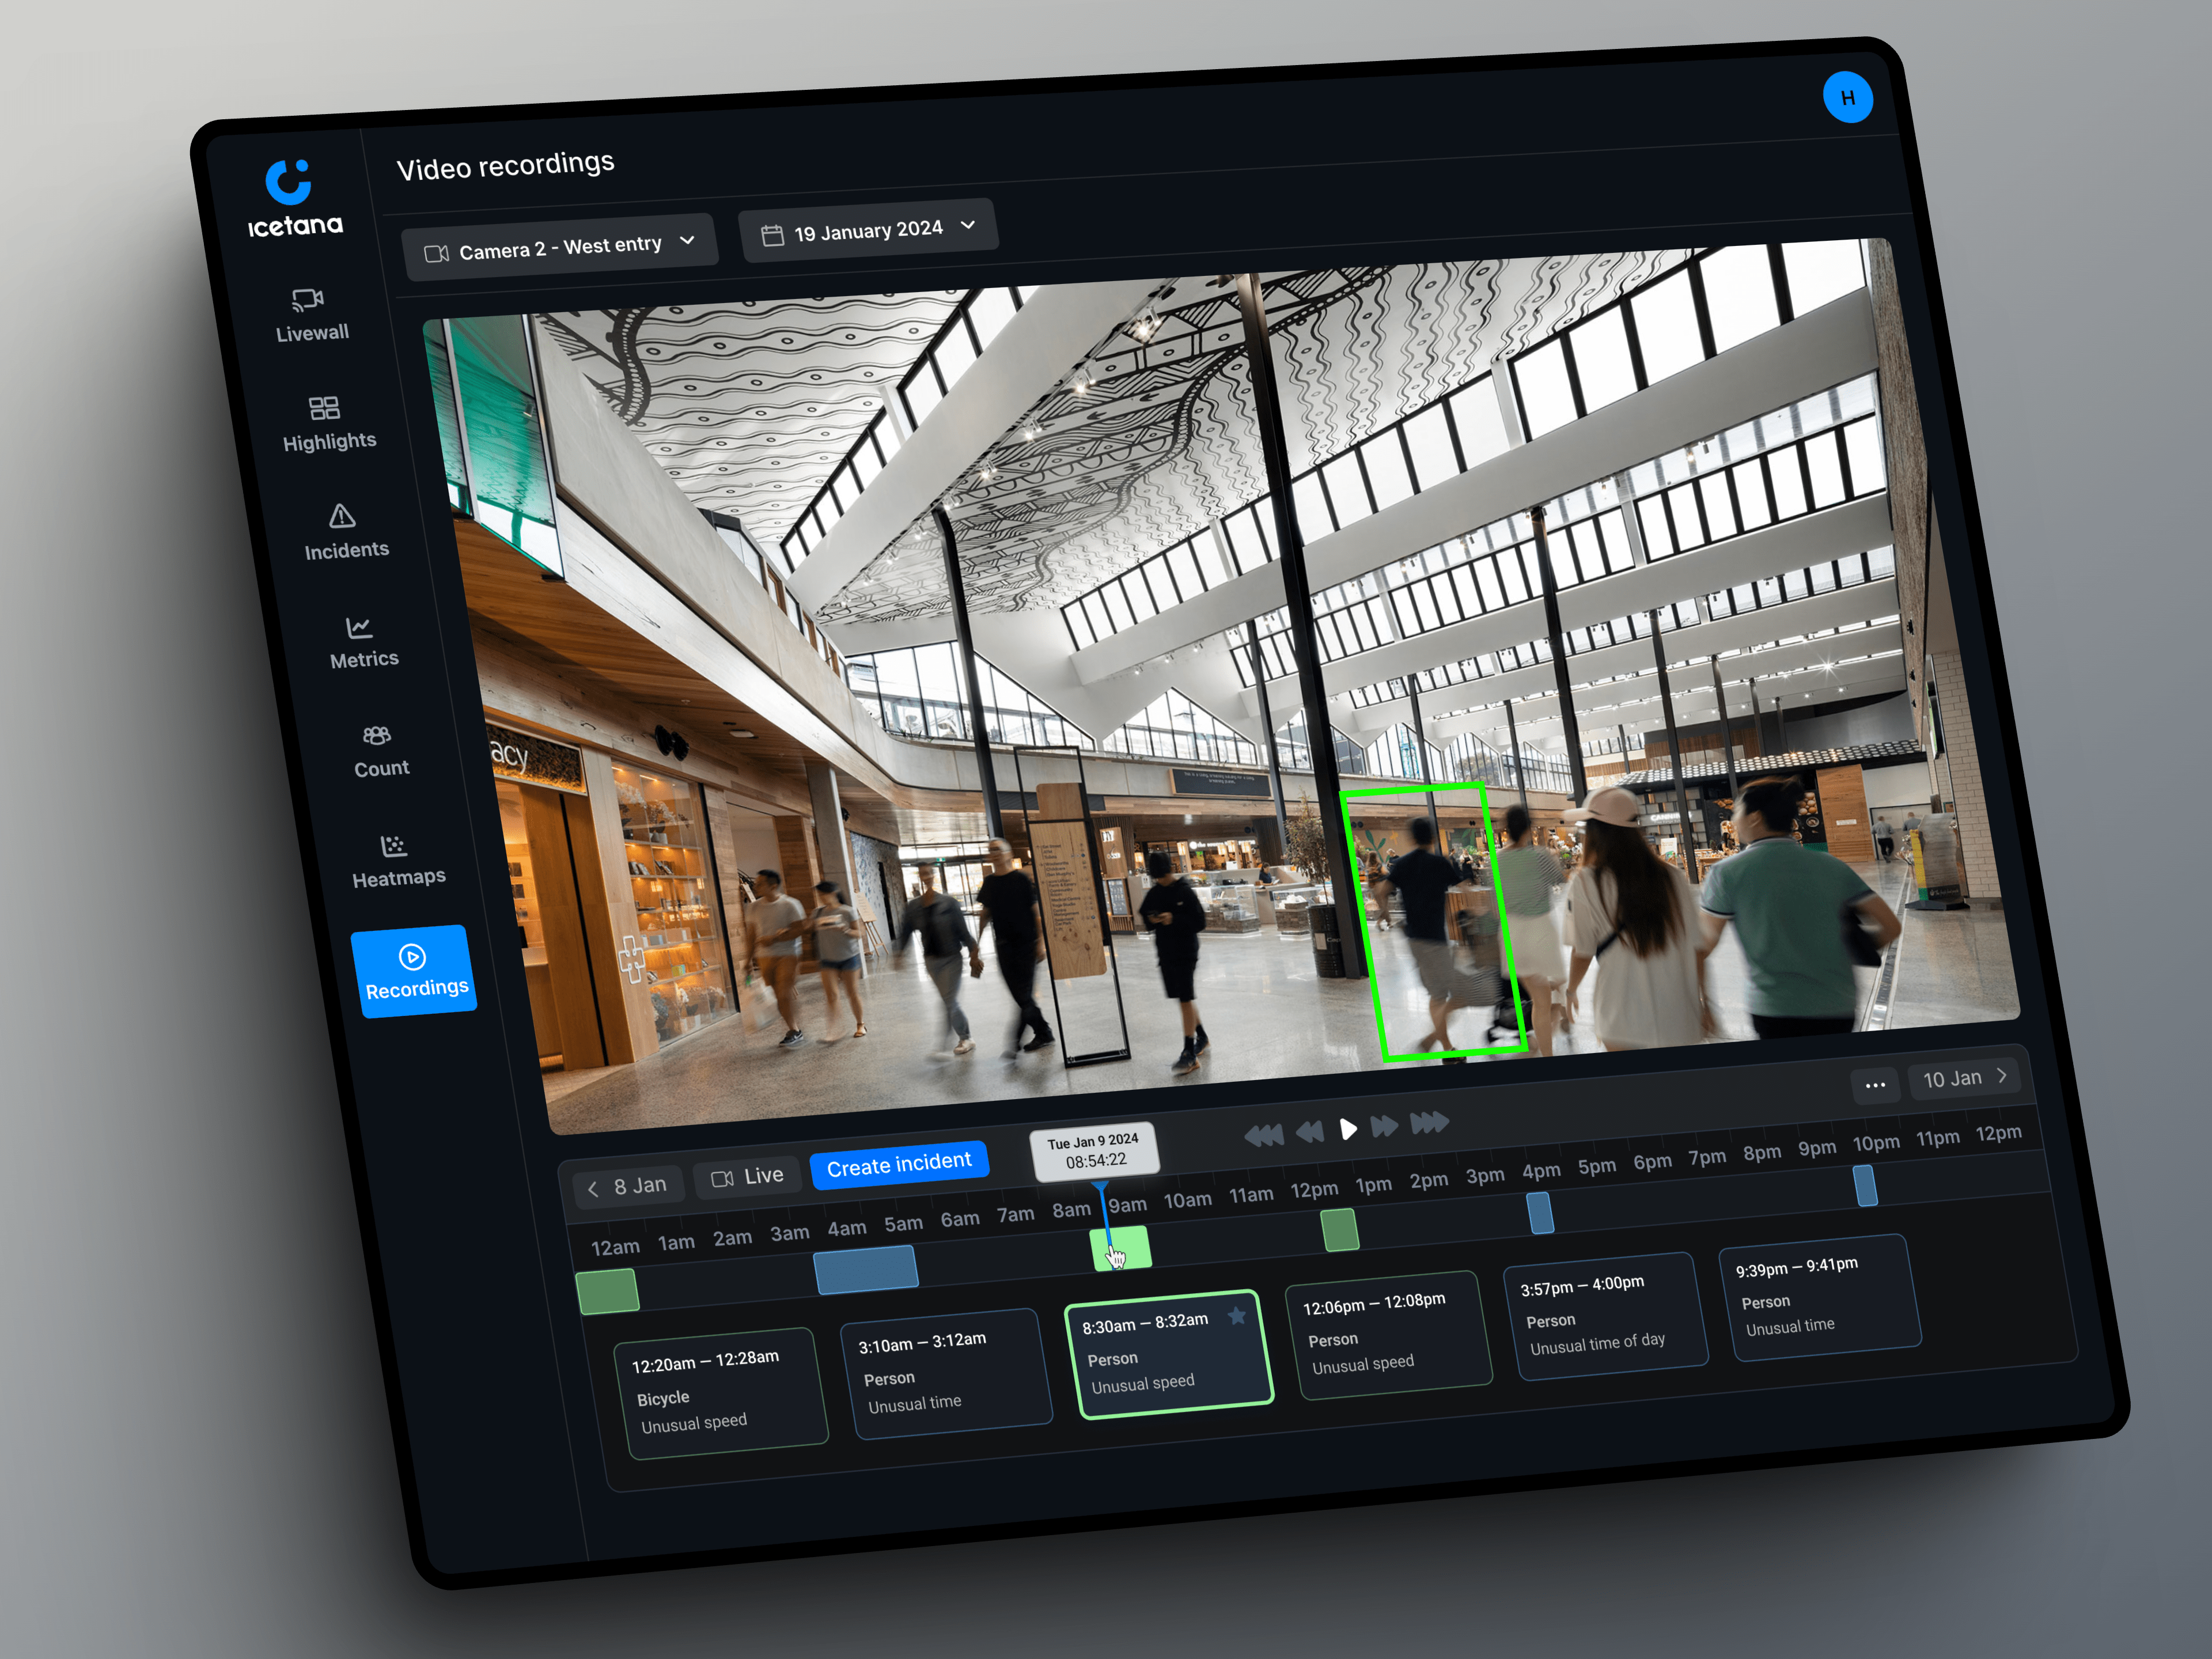
Embedded in a team of machine learning engineers, my role at icetana spans across Product Design and Frontend Engineering, marrying icetana's powerful machine learning models to a user-centred design, allowing security operators to gain valuable insight into their camera networks.
Dashboard
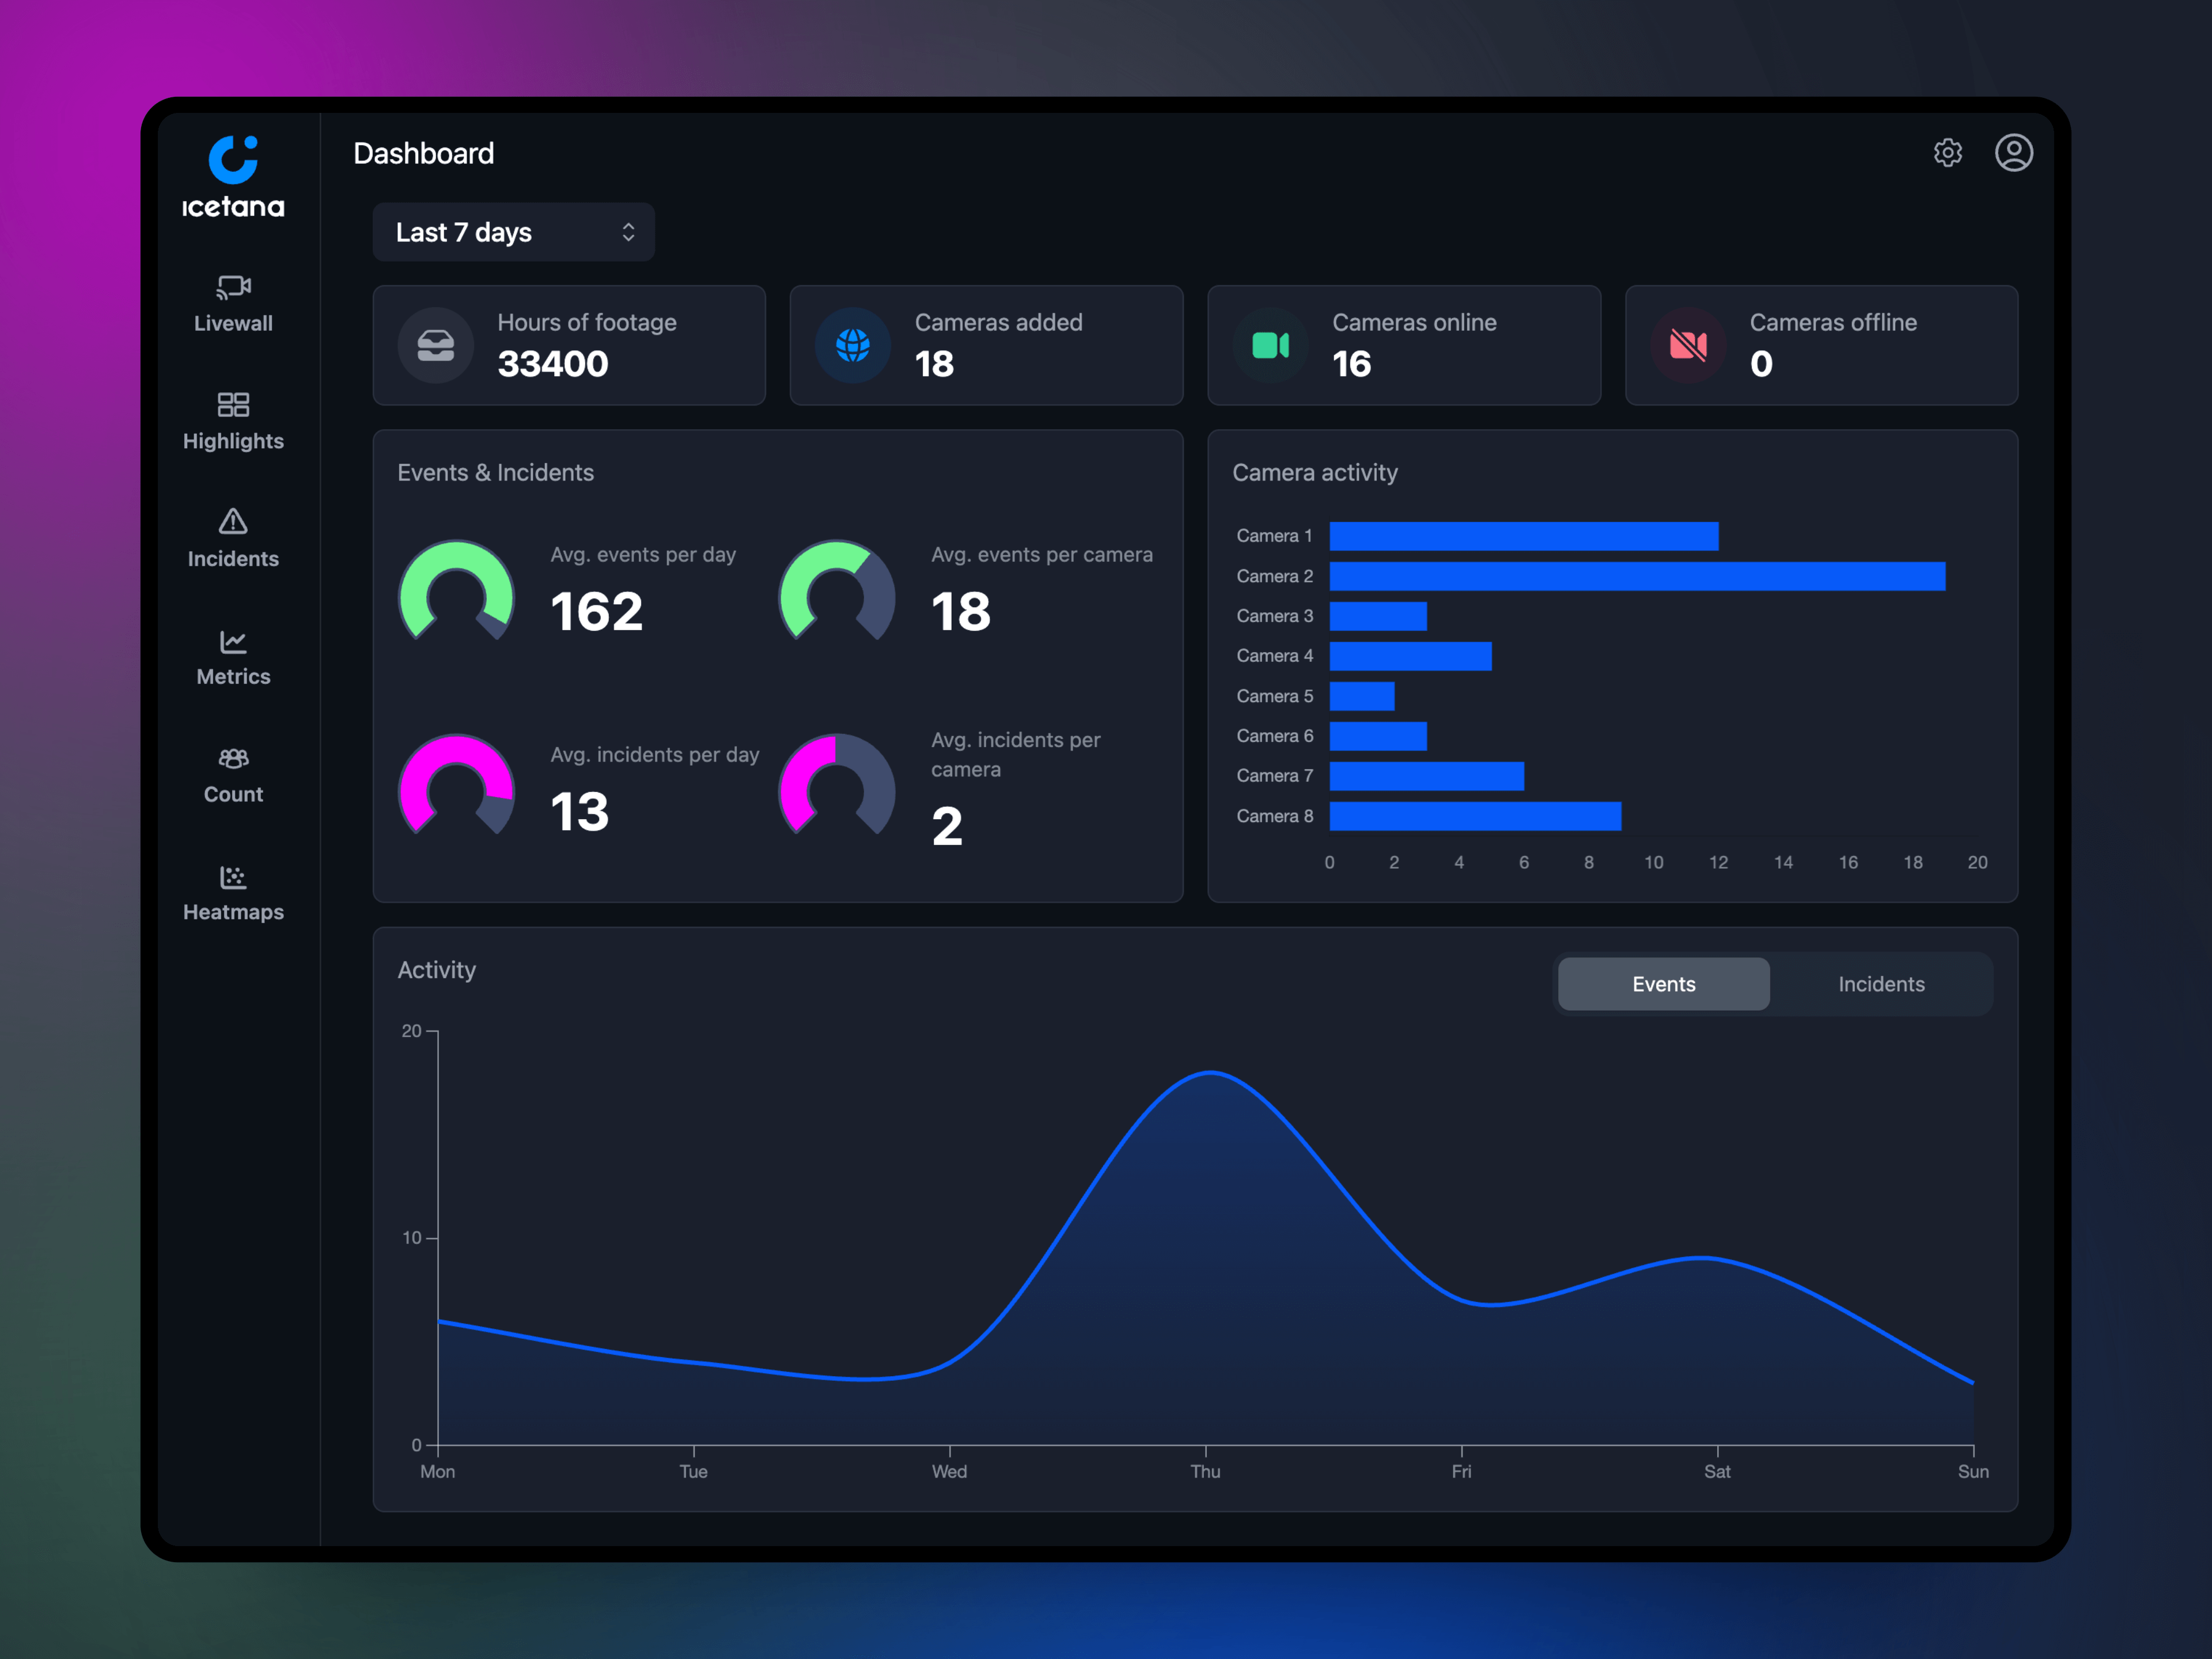
My first project with Icetana involved revising the Dashboard, which was a non-interactive table filled with data and statistics. I was given full autonomy to determine the dashboard's design and functionality, the sole constraint being that I had to work with the existing data. The final product is a clean and intuitive dashboard with some added interactivity to select a time range and to toggle the activity line chart by Events or Incidents.
In the Events & incidents pie charts, I was able to utilise the existing data more effectively by placing the average number over the maximum number in the time range, giving context as to where the average sits in the spectrum.

Heatmaps & Dwell Time
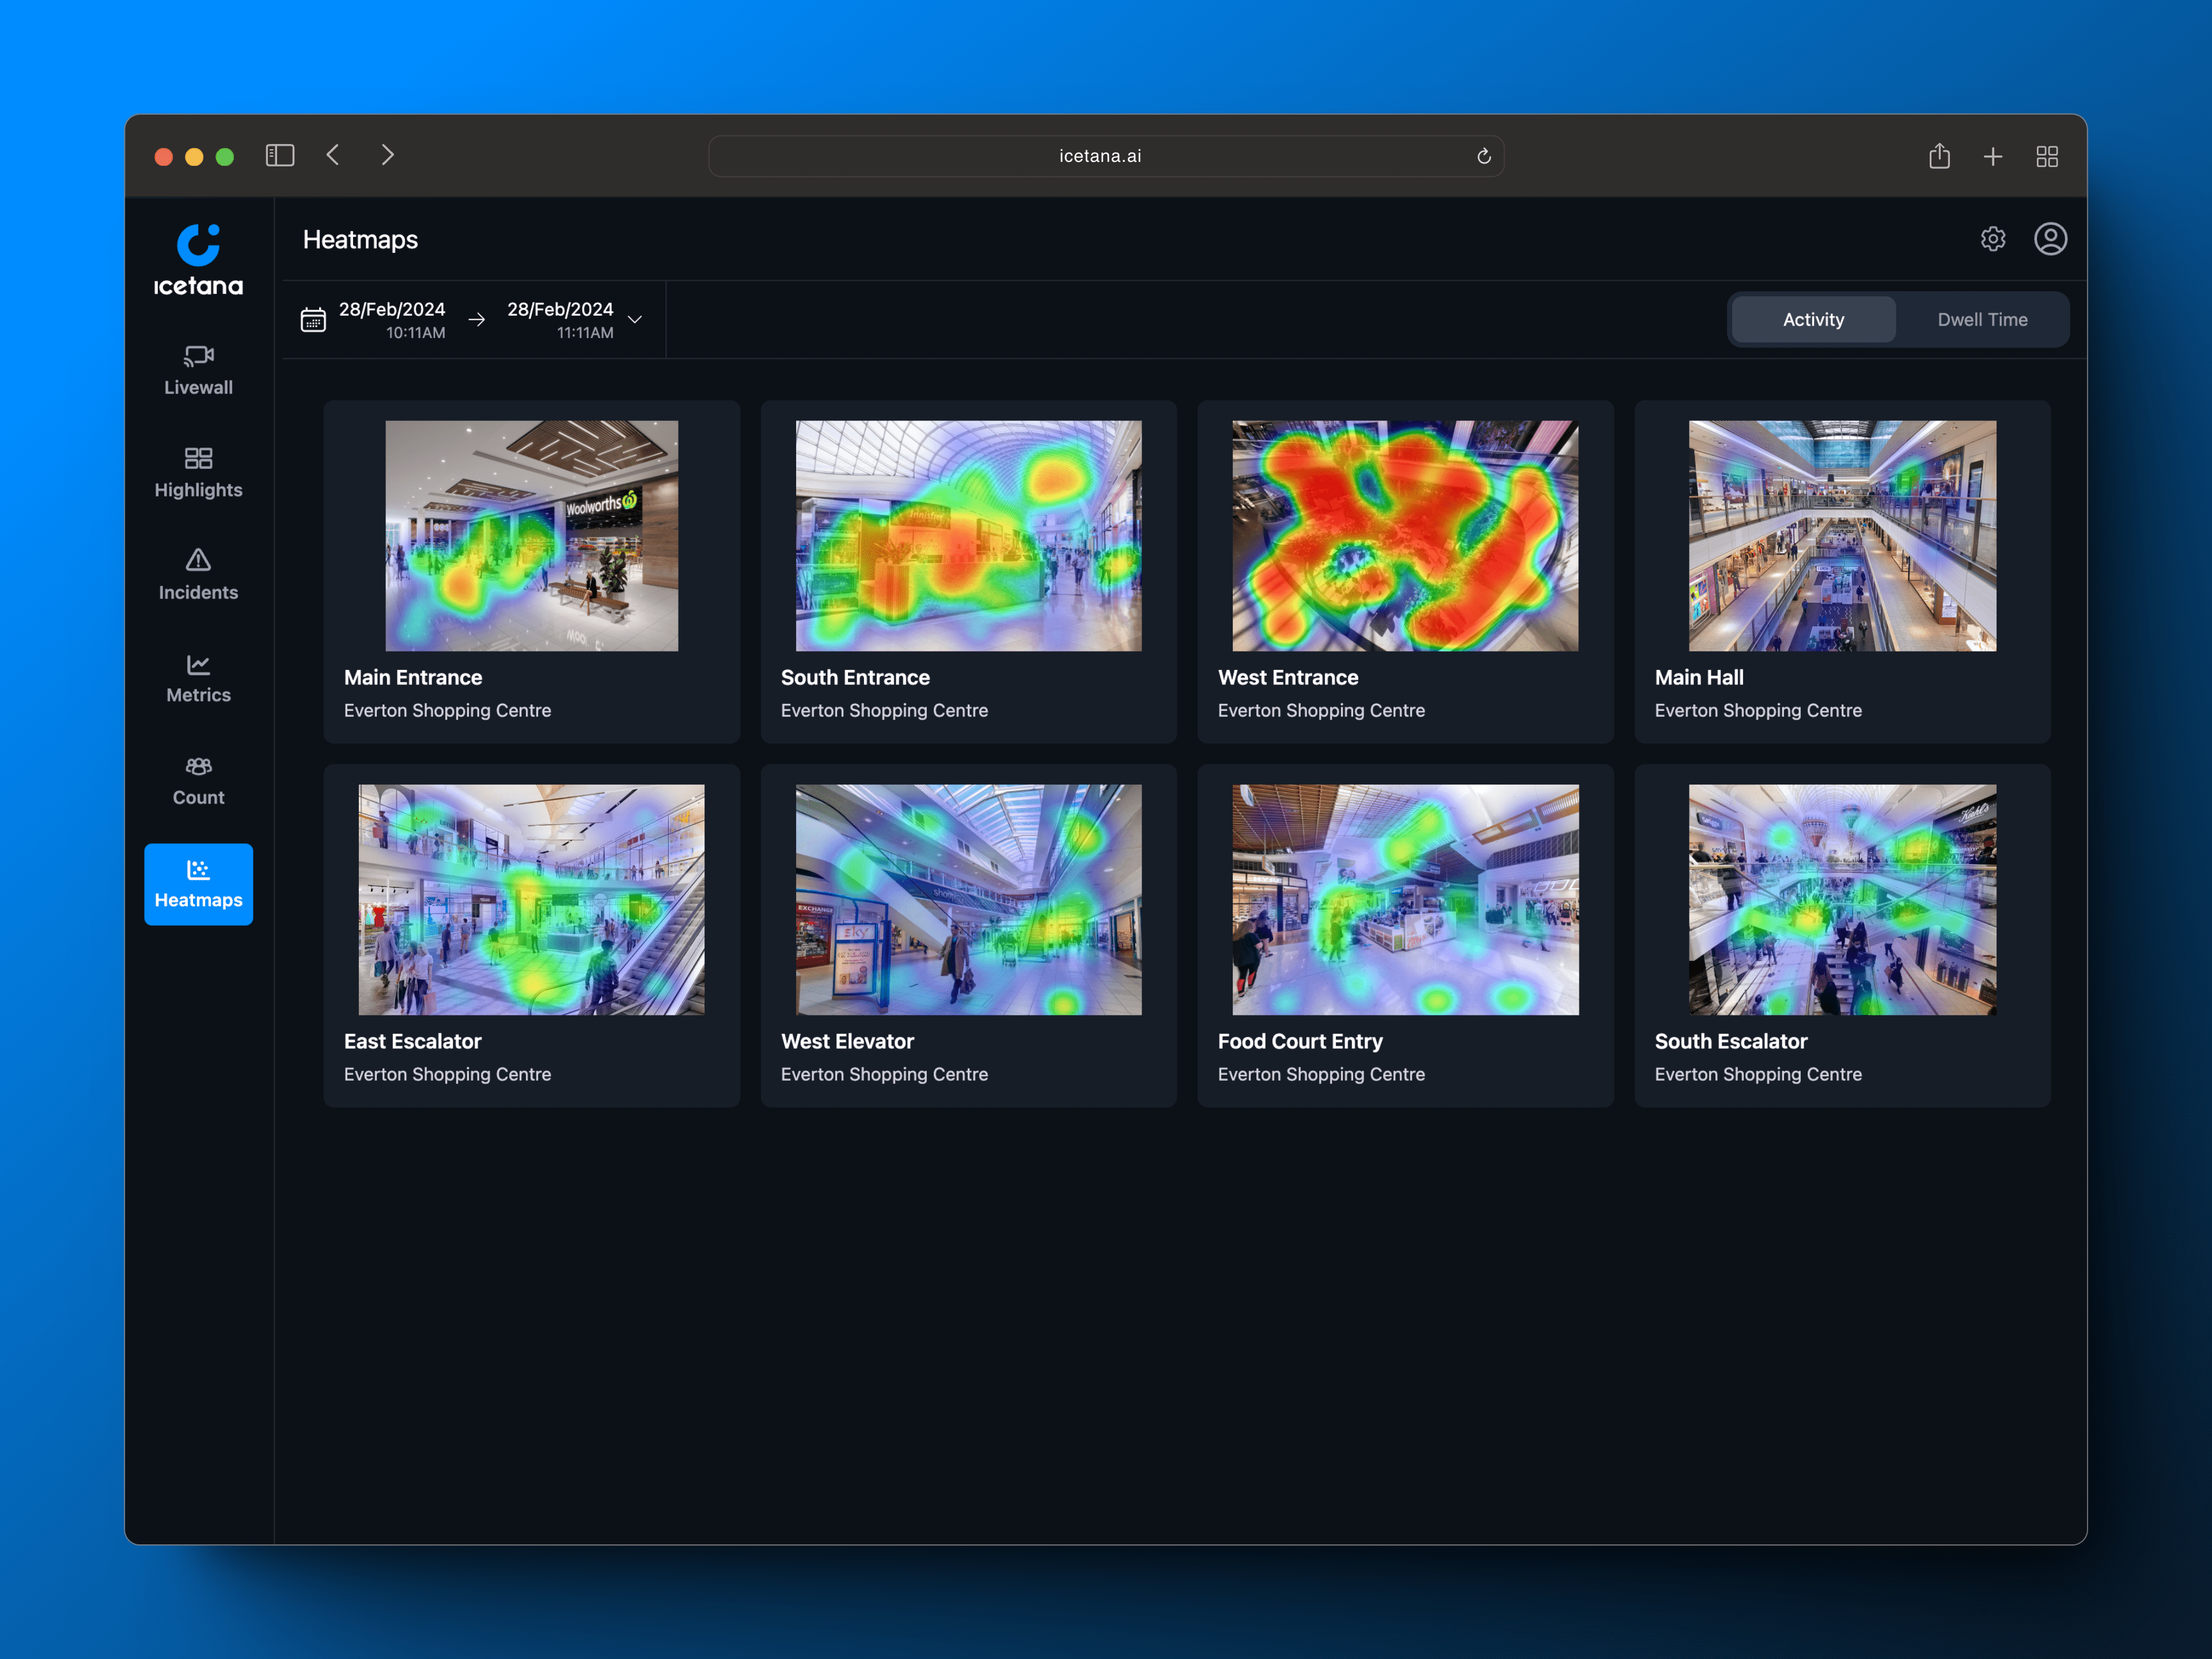
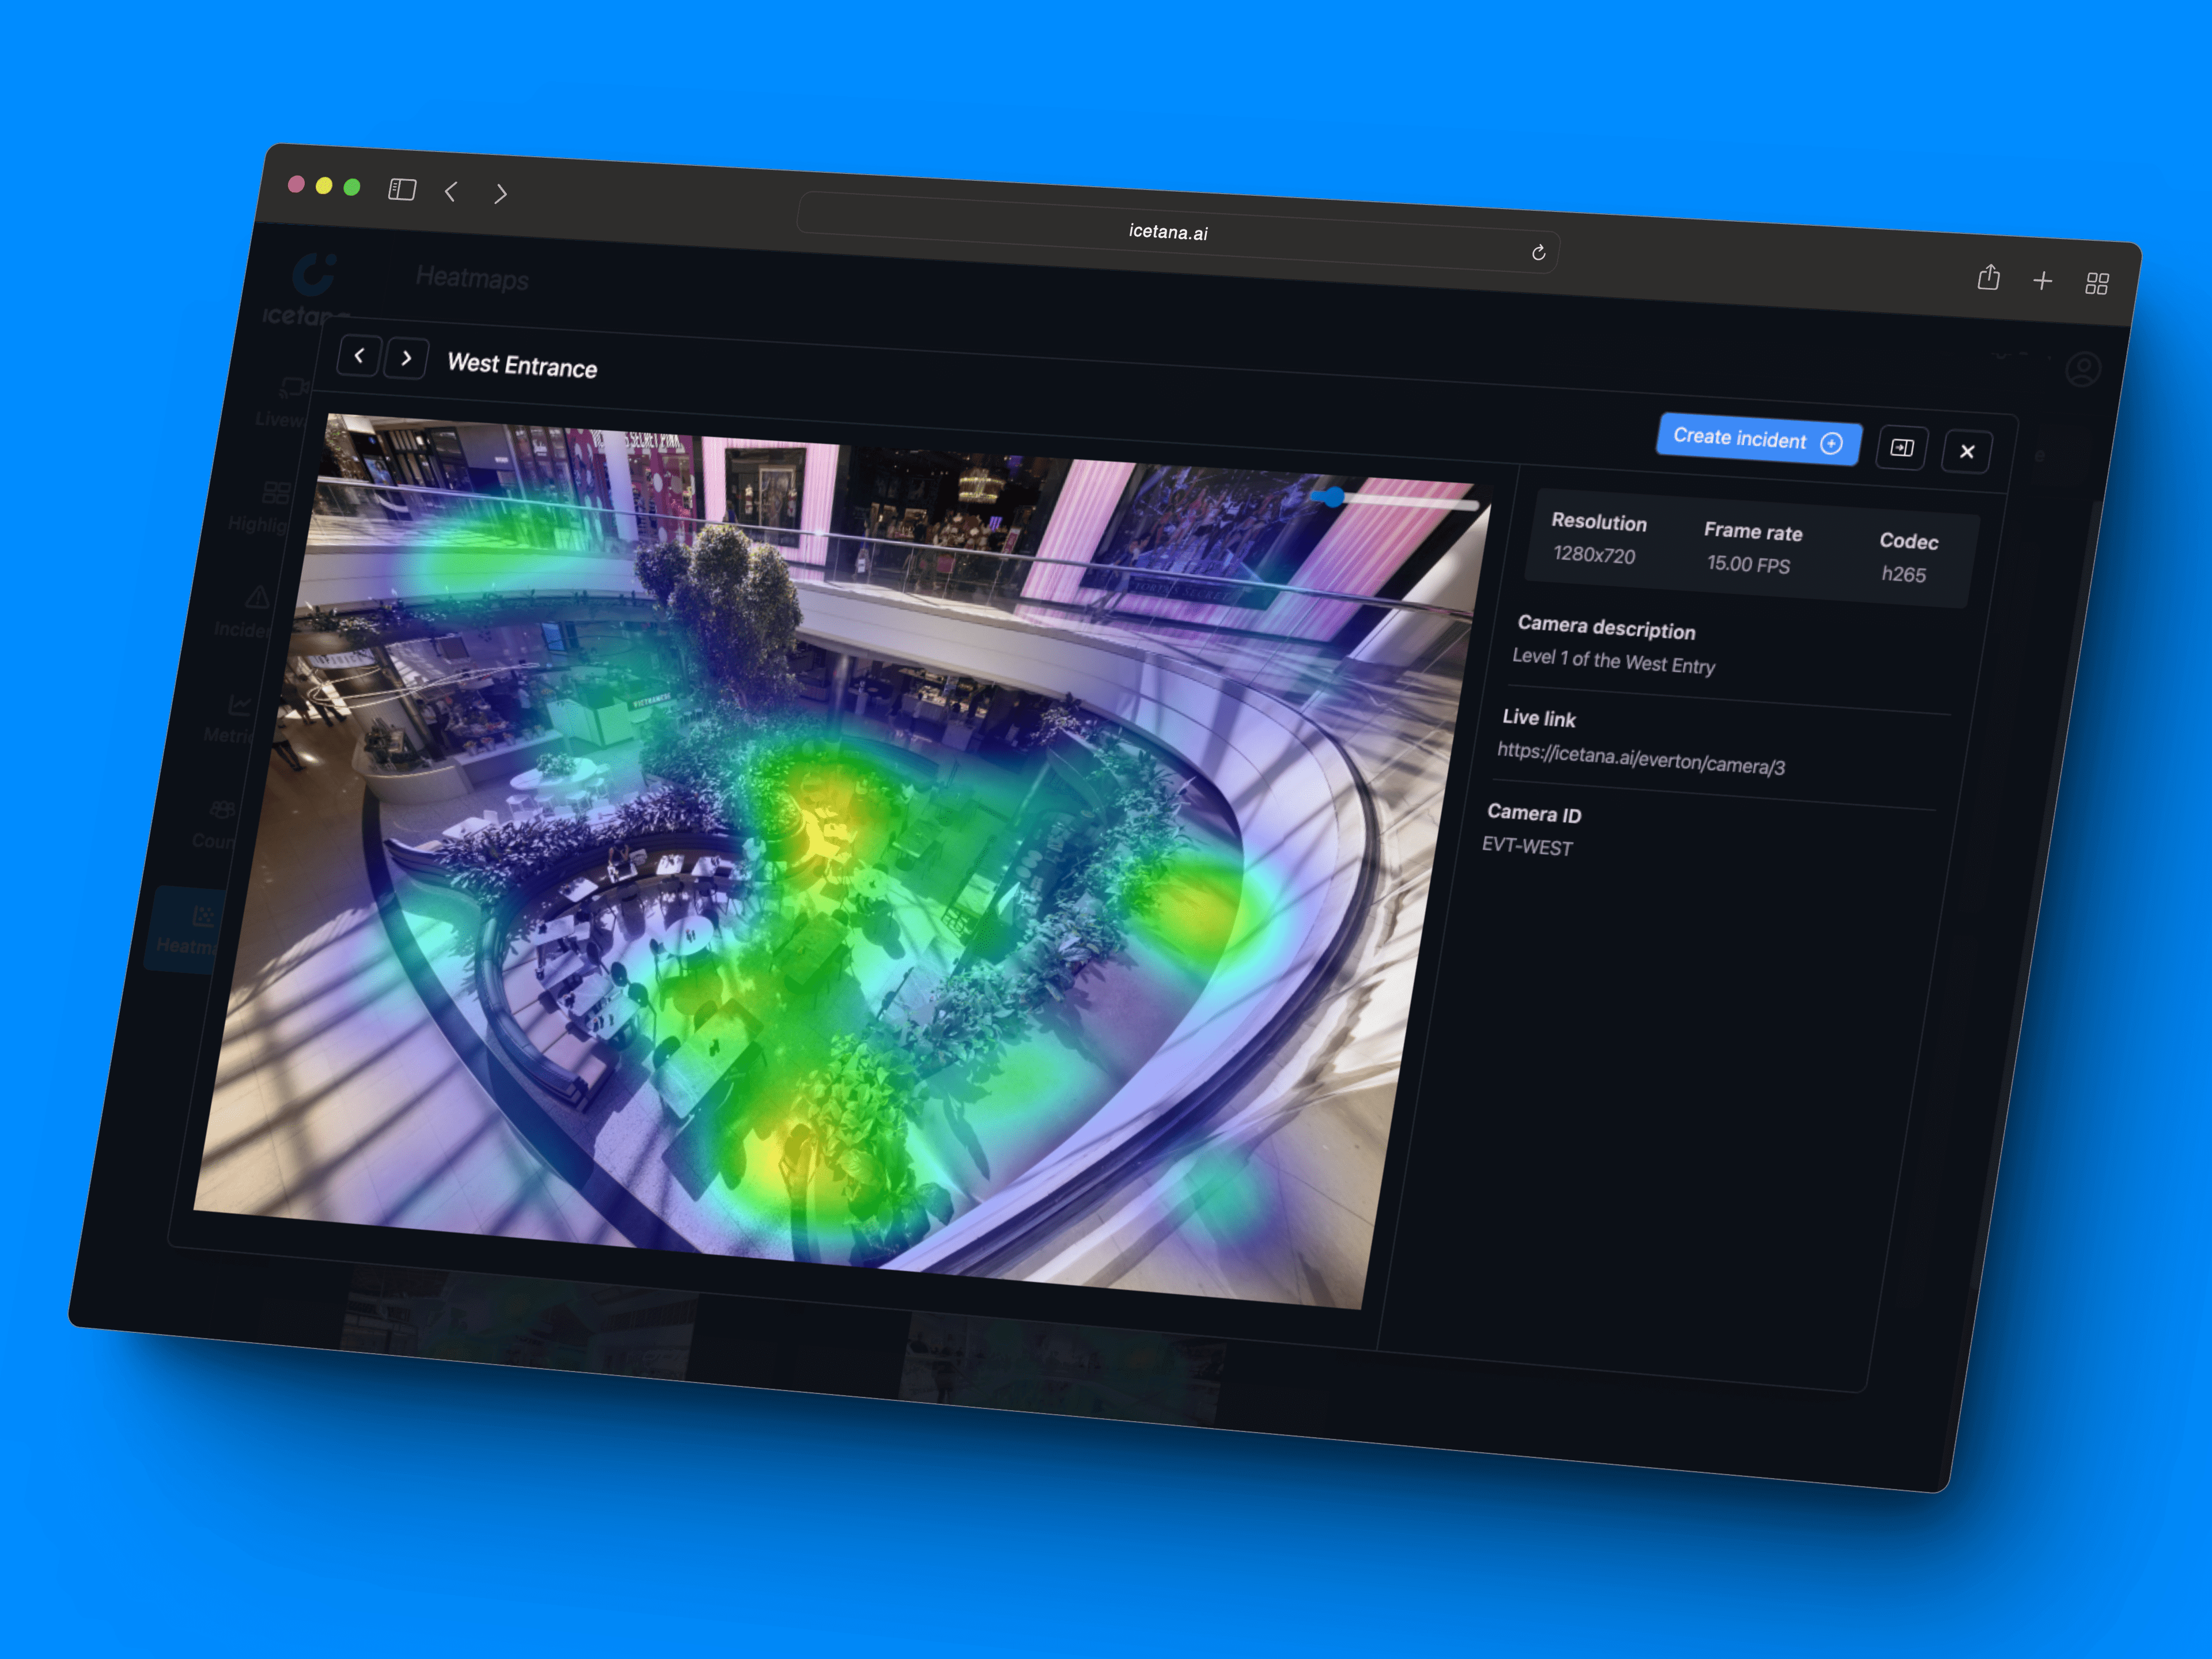
I headed the design and frontend engineering of the Heatmaps feature, conceptualised to offer a new analysis tool to visualise the movement and accumulation of people and vehicles. Gaining insights into traffic patterns, identify high-traffic zones, and determine areas of prolonged dwell time.


In this project, we aimed for a simple visual design, leveraging our established patterns for overlaying data on camera feeds which our customers were already familiar with. The main challenge was in the frontend implementation, which was surprisingly complex and presented a unique set of challenges.
One of the trickiest parts was normalizing the data for the many different camera resolutions, from the standard 640x640, to fisheye, to vertical. Each resolution provided its own downsampled data grid, such as 64x64 or 192x108, or anything in between.
Another challenge was that because the data was so dense, the heatmaps were visually overpowering and the shape would often be a solid red blob covering the camera. To address this I tuned the data scaling and limited large number outliers, which gave us much more indicative and accurate heatmap shapes.
The last challenges centered around pagination and infinite scrolling. Given that there could be hundreds of cameras to analyze, we needed to avoid loading everything at once. This quickly became problematic when combined with the functionality for toggling cameras on/off and filtering heatmaps by people/vehicles. To address this, I implemented a caching solution that stores all previously fetched heatmaps in the background and is compatible with the pagination system. This approach mitigated the need to re-fetch large amounts of data every time a filter was changed.
The feature is now in the hands of our users, and the feedback we have received thus far has been overwhelmingly positive. Our security operators now have unique insights into the hotspots and popular areas within their camera network.
Not only do heatmaps assist with retail analytics and understanding where people travel, but they also help identify potential risks in a scene, discover unusual patterns, and can even be used to improve traffic management in car parks.
More coming soon...
